Wednesday, May 20, 2009

Forex Technical Analysis with Pivot Point as Support and Resistance

What is support and resistance?
Support and resistance might be the most effective technical analysis tool when dealing with fx currency trading. The invisible hand behind this effectiveness is the widely acknowledged theory of supply and demand. Support and resistance sheds light on the shift of market psychology at critical price levels.

Day trading strategies around support and resistance
If the market is uptrend, only long positions are considered, and long at key support levels. If the market is downtrend, only short positions are considered, and short at key resistance levels. If the market is in a trading range, long positions can be established at the bottom of the range, while short positions can be entered at the top of the range.

Pivot point as support and resistance
Pivot point is the average of yesterday's high, low and close. If the market price remains below the pivot point during a trading session, it's deemed bearish for the market, while the price stays above the pivot point, it's bullish for the market. If the following day's market price falls below the pivot point, it may be used as a new resistance level. Conversely, if the market price rises above the pivot point, it may act as the new support level. (definition from investopedia).

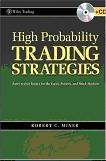
Take euro on May 15, 2009 as example. The pivot point is 1.3609. On both 15-min and hourly charts, it's clear that once the price fell below the pivot point, it became resistance. It almost worked like charm for the second rally, the quite strong up momentum met head wall right at the pivot point level.

forex charts for euro

By the way, this resistance level was also justified by point and figure charts.
point and figure charts for euro

Another example is the British pound on the same day.
forex charts for pound

To conclude, pivot point is a powerful tool for forex technical analysis. It gives important information about support and resistance levels. Forex trading strategies can be developed accordingly based on this information, be it trend trading, swing trading, or scalping.

Friday, May 15, 2009

Forex Technical Analysis with MACD Divergence as Trend Reversal Signal

Trend trading is the most profitable trading strategy in fx currency trading. The catch is that the trend is only your friend until it ends. Since day trader enter and exit their positions the same day, it's vital to gauge the current trend and moment for the trading day. No matter what the previous trend is, there are only two scenarios for current trading day. The price action can be either following the previous trend or reversing the trend.

MACD divergence is a useful technical analysis tool giving hint for potential trend reversal. There are two kinds of divergences. Bearish divergence happens by the end of an uptrend. The market makes higher highs, while MACD forms lower highs; Bullish divergence occurs at the end of a downtrend. The market makes lower lows, while the MACD forms higher lows.

MACD divergence alone can't be used as forex trade signal. Before making any long or short commitment, the current price action should justify the divergence. In another words, confirmation is needed to open a counter-trend day trade. For example, there is a bullish divergence, so the current price is making a lower lower. If the market find support at the new low level and heading upward by either making higher lows or penetrating and standing above resistance, that's the kind of price action for confirmation of trend reversal. If the market keeps making lower lowers, a counter-trend position should never be initiated in that case.

Yesterday was the fourth day of closing down for yen. If the price remain above yesterday's low, it would be unwise to initiate a short position. On hourly candlestick charts, there is a hammer just briefly penetrated yesterday's low 95.13 by 3-pip. The hammer confirmed the support. Dive into the 15-min chart, there is a MACD bullish divergence. For the rest of trading session, yen stays above the new low and of course the previous day's low, while heading north by forming higher lowers, penetrating resistance. This price action offered a high probability trading opportunity to exploit the current upside momentum.

yen hammer confirmed support

yen bullish macd divergence

British pound formed a similar bullish MACD divergence on 15-min candlestick chart. The higher lows confirmed current upside momentum and offered multiple opportunities for establishing long day trades.

pound bullish macd divergence

Monday, May 11, 2009

May 8, 2009 Forex Market Recap

Friday was a beautiful uptrending day for both euro and cable, another good example to apply forex strategies for the advance phase.

After the breakout of the ascending triangle, euro formed a shooting star followed by a hammer on hourly chart, a typical price action to shake out weak hands. Euro offered two great opportunities to long at the breakout of resistance level. The second had a higher probability since the uptrend is confirmed.

euro
euro

Cable formed a top range (1.5160-1.4980) on hourly chart. The strategies to trade a range-bound market is quite different from a trending market. Confirmation is needed for a legit breakout or breakdown. For a true breakout, the price should close above the resistance after the breakout, while a true breakdown, the price should remain below the support after the breakdown.

British pound
British pound

On daily point and figure charts, euro made a double top breakout at 1.35, which cable made a double top breakout at 1.50. Both euro and cable made a new high in twenties trading days (H20).

Yen met major resistance at 99.50 on both point and figure charts and candlesticks.

point and figure charts
Japanese yen

Thursday, May 7, 2009

Forex Strategies for the Decline Phase 05/07/09

In the last post I used British pound as an example to discuss the forex strategies for the advance phase. Yesterday (05/07/2009), pound made another textbook example for the fourth phase in a full price cycle - the decline.

In the decline phase, the market is in a downtrend, usually a short selling day in The Taylor Trading Technique, in which the price action tends to make lower lows and lower highs.

On hourly chart, a bearish engulfing pattern indicated resistance at 1.5160, and the shooting star confirmed the resistance. A 40-pip top range was built from 1.5147 to 1.5106, which is a counterpart of base building phase. Likewise, there are multiple false breakout and breakdown signals to fool reckless bulls and bears.

Pound formed a double top pattern around 1.5160, while MACD made a lower low, the bearish divergence is marked on both 15-min and hourly charts, which confirmed the trend reversal. After the shooting star, there is a quick drop caused by the 7:00 event - Bank of England's Official Bank Rate. There is no way to trade the event, which is almost 100-pip drop in just 1 minute. There is no need to chase the event either. After the event settling down, pound offered multiple great short opportunities for shrewd trader. There are three opportunities to short rally top, and at least two to add position at breakdown horizontal support level.

To summarize the forex strategies for the decline phase,

1. only short position is considered during the decline phase

2. entry A: short at rally top

3. entry B: short at breakdown horizontal support level

Just for argument's sake, the definition of phases is only for forex day trading purpose, which might be only identified on hourly or 15-min charts.