


Thursday, July 16, 2009
July 15, 2009 200+ Forex Pips
This is my third forex trading results report. Both euro and pound were a narrow range day yesterday, a NR7 for euro, and a NR20 for pound. The forex trading strategies - narrow range breakout worked out perfectly for both euro and pound.

Tuesday, July 14, 2009
July 13, 2009 200+ Forex Pips
This is my second forex trading results report. Today the upside momentum is pretty strong and decisive for both euro and pound. The long side directional bias were reinforced when pound held its ground at yesterday's low (1.6165), and euro took a breakout to the upside of its daily pivot point (1.3959). Those price action were perfect for forex swing trading.
All pound positions were closed at 1.62139. And euro positions were stopped out at 1.3964. The stop loss might be moved too close. Anyway, can't complain much for a 200+ forex pips day.
All pound positions were closed at 1.62139. And euro positions were stopped out at 1.3964. The stop loss might be moved too close. Anyway, can't complain much for a 200+ forex pips day.

Friday, July 10, 2009
How I Made 500+ Pips via Forex Day Trading in One Day
Well, this is the first time I decided to post some of my real trading results. The reason I did this is to share the lessons I learned, and encourage those just get started - it is possible to make hundreds of pips in one day. Forex day trading is not rocket science. It takes dedication and hard work to master the art of speculation.
I will not go through the detail of how I made my trading decision. All the analysis and knowledge are scattered around on this blog - Forex Day Trading.
Forex Strategies for July 9, 2009
For Japanese yen: after the down trending day (July 8), the rally formed a double top pattern just below the pivot point (93.19), and dollar is weak. So I decided short usd/jpy.
For British pound: July 8 was a narrow range day (NR20). Pound made a breakout of yesterday's high at the beginning of London session, which gave me a hint July 9 would be an up-trending day. So I mentally prepared myself to follow the lead of any long signal market gave me as long as pound remained above the major resistance 1.6210. There was a double top breakout at 1.6266 on hourly point and figure charts.
For Euro: July 8 was a narrow range day as well (NR20). I had one long position which entered yesterday stopped out at the initial dip, which was still above yesterday's high, maybe I moved my stop loss too close. After the dip, there was a long signal generated when euro broke out the confluence zone on hourly chart - 200EMA, 10-day EMA, top of downward channel all lined up.

The Final Results for July 9, 2009
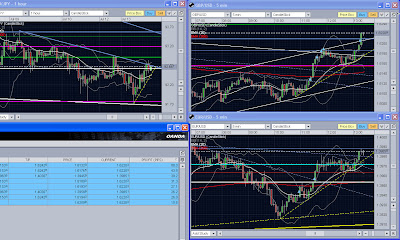
Yen hit my stop loss, I ended with a less than 10 pips loss. I closed GBP/USD when it approached its daily range + 3s.d. (1.6385), since there is only 20% chance of pound will reach 4s.d. according to my study. Naturally I closed EUR/USD at the same time as well. Five long transactions of EUR/USD were excluded, since the above screen shot only showed current opening positions. The final results are 780.9 pips for 14 trades - 7 short usd/jpy, 1 long eur/usd, and 6 long gpb/usd.


What Happened After I Close My Positions?
Yen is still in bearish mode. There is no downside follow through momentum though. I will keep my hands off yen.
It is proved that my exits of pound and euro were exact at the top of the up swing. I didn't enter any long or short position thereafter.
How Do I Generate My Trading Decision?
Before I pull the trigger, I would like to go through the following seven steps to make sure the odds are in my favor. The market would teach me a hard lesson whenever I forgot to do the analysis or missed some steps.
1. Market analysis: What the market is telling me now?
2. Trend analysis: What is current trend?
3. Momentum analysis: What is current momentum?
4. Pattern analysis: Any high probability low risk setup?
5. Timing analysis: Is my timing perfect?
6. Risk analysis: Does my initial protective stop loss make perfect technical sense?
7. Psychology analysis: Am I ready to take the trade?
I will build trades only in the direction of the trend, and scale in when the current momentum lines up with the direction of the trend. If the first trade didn't show my any profit, I won't add a second load. If the first stop loss was hit, I will go through the above process again to make sure I am still in sync with the market.
Best Trading Books That are Particular Helpful
There are some great trading books help me a lot on my journey of forex day trading. Most of them are listed at the left sidebar. I will make the list shorter here, hope it will be helpful to you too.
Japanese Candlestick Charting Techniques, Second Edition
Technical Analysis of the Financial Markets: A Comprehensive Guide to Trading Methods and Applications (New York Institute of Finance)
Point & Figure Charting: The Essential Application for Forecasting and Tracking Market Prices (Wiley Trading)
The Taylor Trading Technique
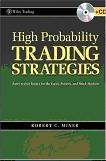
High Probability Trading Strategies: Entry to Exit Tactics for the Forex, Futures, and Stock Markets (Wiley Trading)
Trading for a Living: Psychology, Trading Tactics, Money Management
Street Smarts: High Probability Short-Term Trading Strategies
Final Words
1. Currency forex market trading is quite promising as long as you know what you are doing. You need to work out a forex system which suits your personality or trading style. Not every forex trade signal will turn out to be a winner.
2. Point and figure charts are particular helpful forex technical analysis tool.
3. Not every narrow range day will breakout, and not every breakout will follow through.
4. High probability low risk setups won't occur everyday. Be realistic with your daily trading performance.
5. I sincerely agree with Richard Dennis - the father of Turtle Traders, that trading can be taught and learned through strong dedication and hard work.
I will not go through the detail of how I made my trading decision. All the analysis and knowledge are scattered around on this blog - Forex Day Trading.
Forex Strategies for July 9, 2009
For Japanese yen: after the down trending day (July 8), the rally formed a double top pattern just below the pivot point (93.19), and dollar is weak. So I decided short usd/jpy.
For British pound: July 8 was a narrow range day (NR20). Pound made a breakout of yesterday's high at the beginning of London session, which gave me a hint July 9 would be an up-trending day. So I mentally prepared myself to follow the lead of any long signal market gave me as long as pound remained above the major resistance 1.6210. There was a double top breakout at 1.6266 on hourly point and figure charts.
For Euro: July 8 was a narrow range day as well (NR20). I had one long position which entered yesterday stopped out at the initial dip, which was still above yesterday's high, maybe I moved my stop loss too close. After the dip, there was a long signal generated when euro broke out the confluence zone on hourly chart - 200EMA, 10-day EMA, top of downward channel all lined up.

The Final Results for July 9, 2009
Yen hit my stop loss, I ended with a less than 10 pips loss. I closed GBP/USD when it approached its daily range + 3s.d. (1.6385), since there is only 20% chance of pound will reach 4s.d. according to my study. Naturally I closed EUR/USD at the same time as well. Five long transactions of EUR/USD were excluded, since the above screen shot only showed current opening positions. The final results are 780.9 pips for 14 trades - 7 short usd/jpy, 1 long eur/usd, and 6 long gpb/usd.


What Happened After I Close My Positions?
Yen is still in bearish mode. There is no downside follow through momentum though. I will keep my hands off yen.
It is proved that my exits of pound and euro were exact at the top of the up swing. I didn't enter any long or short position thereafter.
How Do I Generate My Trading Decision?
Before I pull the trigger, I would like to go through the following seven steps to make sure the odds are in my favor. The market would teach me a hard lesson whenever I forgot to do the analysis or missed some steps.
1. Market analysis: What the market is telling me now?
2. Trend analysis: What is current trend?
3. Momentum analysis: What is current momentum?
4. Pattern analysis: Any high probability low risk setup?
5. Timing analysis: Is my timing perfect?
6. Risk analysis: Does my initial protective stop loss make perfect technical sense?
7. Psychology analysis: Am I ready to take the trade?
I will build trades only in the direction of the trend, and scale in when the current momentum lines up with the direction of the trend. If the first trade didn't show my any profit, I won't add a second load. If the first stop loss was hit, I will go through the above process again to make sure I am still in sync with the market.
Best Trading Books That are Particular Helpful
There are some great trading books help me a lot on my journey of forex day trading. Most of them are listed at the left sidebar. I will make the list shorter here, hope it will be helpful to you too.
Japanese Candlestick Charting Techniques, Second Edition
Technical Analysis of the Financial Markets: A Comprehensive Guide to Trading Methods and Applications (New York Institute of Finance)
Point & Figure Charting: The Essential Application for Forecasting and Tracking Market Prices (Wiley Trading)
The Taylor Trading Technique
High Probability Trading Strategies: Entry to Exit Tactics for the Forex, Futures, and Stock Markets (Wiley Trading)
Trading for a Living: Psychology, Trading Tactics, Money Management
Street Smarts: High Probability Short-Term Trading Strategies
Final Words
1. Currency forex market trading is quite promising as long as you know what you are doing. You need to work out a forex system which suits your personality or trading style. Not every forex trade signal will turn out to be a winner.
2. Point and figure charts are particular helpful forex technical analysis tool.
3. Not every narrow range day will breakout, and not every breakout will follow through.
4. High probability low risk setups won't occur everyday. Be realistic with your daily trading performance.
5. I sincerely agree with Richard Dennis - the father of Turtle Traders, that trading can be taught and learned through strong dedication and hard work.
Thursday, July 9, 2009
July 8, Forex Market Recap
For Japanese yen, Tuesday (7/7/2009) was an inside day (ID) with a daily range of 75-pip. Since last Friday (7/3/2009) was a holiday, which qualify Tuesday as a narrow range day (NR7).
Yen broke Tuesday's lower boundary in Asian session, which put yen in a very bearish mood, since it's a NR7/ID breakdown. Yen formed a small range and remained below yesterday's low for the whole London session and early US session. The downside follow through happened around 11:00am, which was decisive and dropped 233-pip in two hours, that is 7.3 s.d. out of average daily range. The bears are laughing all the way to the bank. There is an instant 150-pip rally after yen hit the bottom of a downward channel on daily charts.
On daily point and figure charts, there is a double bottom breakdown at 94.00. Look at hourly PnF, there is a double bottom breakdown on July 5 at 95.50, the downward momentum continued and broke support at 95.00 and 94.00 on July 6, and July 8 individually.
So the forex strategies for narrow range and inside day is to follow which direction the market is leading and prepare for a trending day. There is no need to predict direction or put personal bias on the market.


Wednesday, July 1, 2009
July 1, 2009 Forex Market Recap
After the 8:15am event, British pound rallied until met resistance at pivot point (1.6543), and formed a symmetrical triangle pattern. For such pattern there is no need to predict the breakout direction, since both directions are possible. It turned out it's a breakdown.

Last night, euro formed a double bottom at yesterday's low 1.4001. The reversal signal was given at the beginning of London session after a breakout from the bottom range. After the breakout, the temporary dip found support at the top of the bottom range. A high probability long position entry was given when euro took a breakout from the symmetrical triangle. The rally reached euro's average daily range at 1.4164, which is right above yesterday's high 1.4152. There is a 70-pip spike in just 3 minutes (11:58-12:00pm).

Forex alerts for July 2, 2009
Yen was a NR7 today. Be prepared for a trending day.
Thursday, June 25, 2009
Short Selling Day for Both Pound and Euro
Euro made a fake breakout at the beginning of London session. A temporary support was found at pivot point 1.4006. The breakdown from the descending triangle pattern gave away the true intention of the market - downward. Pivot point also shifted as resistance after the breakdown. Euro reached its second downward goal at 1.3892 (average daily range + 1sd).

Pound had a similar behavior as euro. There is a strong resistance from 1.66 (on daily point and figure charts, pound formed a triple top pattern at 1.66). After breakdown the top of former day 1.6474, it changed as resistance as well. The downward momentum found a temporary support at the confluence zone of pivot point (1.6379) and 10-day EMA (1.6368).

The forex trading strategies for a short selling day is to follow the downward momentum and establish short positions. For both pound and euro, the high probability and low risk forex trade signal was given at the breakdown of former day's high and pivot point respectively.
Wednesday, June 17, 2009
Timing the Entry for Intra-Day Forex Trading
Timing the entry is the key factor to the success of currency forex online trading. The first step to time the entry is to have a decent forex day trading system, be it trend trading, forex swing trading, or forex scalping. The second step is to have the patience waiting for the maturity of whatever setup your are ambushing. Since you already know what exactly you are expecting, timing the entry will make cutting loss and riding winner much easier.
Timing the entry doesn't need to predict the market. On the contrary, it requires to follow what the market is leading at the present.
Timing the entry also means you are willing to stay flat if there is no forex trading signal triggered by your forex day trading system.
In a single trading session, there might be only 3 ~ 5 high probability low risk forex day trading setups. So most of the time, shrewd day traders just stand aside and watch how the market unfold its structure.
Take June 17, 2009 British pound as an example, after pound found support at 1.6233, which is clearly shown on hourly point and figure charts, there is an ascending triangle pattern formed around 10-day EMA 1.6296. Under this circumstance, a seasoned day trader is willing to make a long commitment only after pound breakout the resistance of the ascending triangle. So why not just long after pound found support? The support alone didn't trigger the long trading signal. It might just be a temporary pause of the downward momentum. Remember, to be succeed in currency forex market trading, there is no need to predict the market direction. Once pound breakout the overhead resistance of the ascending triangle, we have confidence that a long position is a high probability low risk trade. By the way, there is a malicious shaken-out after the breakout. The 40-pip dip found support at the 10-day EMA.

So be advised to time the entry for your next currency day trading. You are right on your way to remain disciplined.
Thursday, June 11, 2009
June 11, 2009 Forex Market Recap
British pound made its first attempt to breakout the high of June 10 (1.6473) during London session. This breakout lacked follow through price action, which is a typical trick for a narrow range day play ( NR7). Nevertheless, this dip was still above the pivot point, and formed a higher low, which indicated the uptrend is still intact. After the 8:30am event, pound made another breakout, long at this spot would be a high probability trade. On hourly point and figure charts, pound made a double top breakout pattern at 1.6466.

After the 8:30am event, euro formed a pin bar and higher low on hourly chart, which sat on the upward trend line. There is a confluence of pivot point (1.4010) and 10-day EMA (1.4012) for euro. After breakout this confluence zone, the upswing surpassed another confluence area of downward trend line and 200 EMA on hourly chart. Euro rallied the most of US session and reached its daily range (the green horizontal line).

Japanese yen offered two great swing opportunities. The first opportunity happened in London session after yen crossed the pivot point 97.91. The up swing met resistance around the high of June 10 (98.43), and formed a pin bar on hourly candlestick chart. This resistance was also reinforced by the downward trend line, which offered a great short swing opportunity. The down swing ended at the 200 EMA on hourly chart.

Friday, June 5, 2009
Day Trading Rules
Like any other endeavors in life, there are certain rules needed to be aware of in day trading business. Regardless which market you are participating, be it forex trading, stock trading, or futures trading, or which day trading strategies you are applying, be it trend trading, swing trading or scalping, these rules need to be followed by the pixel to get ahead in this tough business. On their journeys to achieve consistency, lots of day trader pleaded guilty to break some of these day trading rules listed below,
Rules #1 Trading on the Edge
The first and most important day trading rules is always trading on the edge. No matter how experienced you are or how confident you are about a specific trading setup. Day trading is a profession incurring substantial financial risk. Market can and surely it will do whatever it likes at anytime. Day trading is kind of like swimming in the shark infested water. So day trader should always be alert. Even experienced pros can't afford to let their guards down. Market seems have a magic power to catch people whenever they are pants-off. Most day trader have paid their tuition and learned this lesson in a hard way. It's much better to be prepared upfront to psych up with the merciless reality of day trading.
Rules #2 Preserve Precious Capital
When talking about trading, most people heard a lot about "cut loss short, let profit run". What exactly does that mean? It precisely captures the essence of preserving precious capital. There is a quote in Reminiscences of a Stock Operator which gives us a vivid example of applying this rule in real trading, "I did precisely the wrong thing. The cotton showed me a loss and I kept it. The wheat showed me a profit and I sold it out. Of all the speculation blunders there are few greater than trying to average a losing game. Always sell what shows you a loss and keep what shows you a profit."
Rules #3 Trading with An Edge
In Art of War, Sunzi said, "Every battle is won before it is ever fought." Everyone evolved in the market wants to win that's for sure. In a tough arena like day trading, it is believed that only 5% of people consistently taking money out of the market. Day trader definitely need an edge to surpass the rest 95%. So what exactly is a trading edge? Generally speaking, whatever can get you ahead of the game to achieve consistency that's your edge, be it technical, fundamental, psychological, or physical. For example, if point and figure charts helps to make your forex pips, then PnF is your technical edge.
Rules #4 Know Yourself - Know the Market
Obviously this rule is borrowed from the Art of War - "know your enemy, know yourself, and you will win the whole 100 battles". The first half of this rule is to know yourself. Before the starting of each trading session, before initiating a new transaction, after each trade, by the end of each trading session, there are certain questions to ask yourself - Did I remain COOL & CALM & DETACHED? What a professional trader would do under the same circumstance? Did I follow my rules? What might be done differently? What did I learn from today's trading? This self-analysis process will help day trader to stay at their peak performance by avoiding negative self-sabotage psychological trap. The other half of this rule is to know the market. Cause different market situations require different approaches, it's vital to know what the market is doing now - uptrend, downtrend or sideways. It's a wild dream to achieve 100 victories in a row, but by mastering yourself and the market will definitely put odds in day trader's favor, hence significantly help to improve their trading performance.
Rules #5 Plan the Trade, Trade the Plan
Day Trading is a serious business. Like any normal business, day trader need a complete business plan to succeed. Specifically, they need a daily battle plan to operate their small business day in and day out. A trading Plan is day trader's map to success.
Rules #6 Trading at the Present
The only truth in the market is the current PRICE. That's the only information professional day trader need to make a trading decision. So forget about the news, forget about other people's opinions, and forget about any personal biases, and Trade what you see not what you think.
That's the end of the first part of day trading rules. The second part of another six rules will be discussed in the next post.
Wednesday, May 20, 2009
Forex Technical Analysis with Pivot Point as Support and Resistance
What is support and resistance?
Support and resistance might be the most effective technical analysis tool when dealing with fx currency trading. The invisible hand behind this effectiveness is the widely acknowledged theory of supply and demand. Support and resistance sheds light on the shift of market psychology at critical price levels.
Day trading strategies around support and resistance
If the market is uptrend, only long positions are considered, and long at key support levels. If the market is downtrend, only short positions are considered, and short at key resistance levels. If the market is in a trading range, long positions can be established at the bottom of the range, while short positions can be entered at the top of the range.
Pivot point as support and resistance
Pivot point is the average of yesterday's high, low and close. If the market price remains below the pivot point during a trading session, it's deemed bearish for the market, while the price stays above the pivot point, it's bullish for the market. If the following day's market price falls below the pivot point, it may be used as a new resistance level. Conversely, if the market price rises above the pivot point, it may act as the new support level. (definition from investopedia).
Take euro on May 15, 2009 as example. The pivot point is 1.3609. On both 15-min and hourly charts, it's clear that once the price fell below the pivot point, it became resistance. It almost worked like charm for the second rally, the quite strong up momentum met head wall right at the pivot point level.
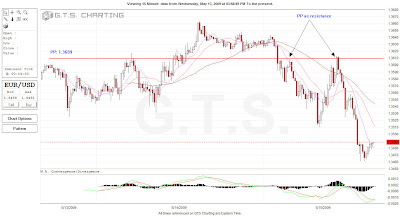

By the way, this resistance level was also justified by point and figure charts.

Another example is the British pound on the same day.


To conclude, pivot point is a powerful tool for forex technical analysis. It gives important information about support and resistance levels. Forex trading strategies can be developed accordingly based on this information, be it trend trading, swing trading, or scalping.
Friday, May 15, 2009
Forex Technical Analysis with MACD Divergence as Trend Reversal Signal
Trend trading is the most profitable trading strategy in fx currency trading. The catch is that the trend is only your friend until it ends. Since day trader enter and exit their positions the same day, it's vital to gauge the current trend and moment for the trading day. No matter what the previous trend is, there are only two scenarios for current trading day. The price action can be either following the previous trend or reversing the trend.
MACD divergence is a useful technical analysis tool giving hint for potential trend reversal. There are two kinds of divergences. Bearish divergence happens by the end of an uptrend. The market makes higher highs, while MACD forms lower highs; Bullish divergence occurs at the end of a downtrend. The market makes lower lows, while the MACD forms higher lows.
MACD divergence alone can't be used as forex trade signal. Before making any long or short commitment, the current price action should justify the divergence. In another words, confirmation is needed to open a counter-trend day trade. For example, there is a bullish divergence, so the current price is making a lower lower. If the market find support at the new low level and heading upward by either making higher lows or penetrating and standing above resistance, that's the kind of price action for confirmation of trend reversal. If the market keeps making lower lowers, a counter-trend position should never be initiated in that case.
Yesterday was the fourth day of closing down for yen. If the price remain above yesterday's low, it would be unwise to initiate a short position. On hourly candlestick charts, there is a hammer just briefly penetrated yesterday's low 95.13 by 3-pip. The hammer confirmed the support. Dive into the 15-min chart, there is a MACD bullish divergence. For the rest of trading session, yen stays above the new low and of course the previous day's low, while heading north by forming higher lowers, penetrating resistance. This price action offered a high probability trading opportunity to exploit the current upside momentum.


British pound formed a similar bullish MACD divergence on 15-min candlestick chart. The higher lows confirmed current upside momentum and offered multiple opportunities for establishing long day trades.

Monday, May 11, 2009
May 8, 2009 Forex Market Recap
Friday was a beautiful uptrending day for both euro and cable, another good example to apply forex strategies for the advance phase.
After the breakout of the ascending triangle, euro formed a shooting star followed by a hammer on hourly chart, a typical price action to shake out weak hands. Euro offered two great opportunities to long at the breakout of resistance level. The second had a higher probability since the uptrend is confirmed.


Cable formed a top range (1.5160-1.4980) on hourly chart. The strategies to trade a range-bound market is quite different from a trending market. Confirmation is needed for a legit breakout or breakdown. For a true breakout, the price should close above the resistance after the breakout, while a true breakdown, the price should remain below the support after the breakdown.


On daily point and figure charts, euro made a double top breakout at 1.35, which cable made a double top breakout at 1.50. Both euro and cable made a new high in twenties trading days (H20).
Yen met major resistance at 99.50 on both point and figure charts and candlesticks.


Thursday, May 7, 2009
Forex Strategies for the Decline Phase 05/07/09
In the last post I used British pound as an example to discuss the forex strategies for the advance phase. Yesterday (05/07/2009), pound made another textbook example for the fourth phase in a full price cycle - the decline.
In the decline phase, the market is in a downtrend, usually a short selling day in The Taylor Trading Technique , in which the price action tends to make lower lows and lower highs.
On hourly chart, a bearish engulfing pattern indicated resistance at 1.5160, and the shooting star confirmed the resistance. A 40-pip top range was built from 1.5147 to 1.5106, which is a counterpart of base building phase. Likewise, there are multiple false breakout and breakdown signals to fool reckless bulls and bears.
Pound formed a double top pattern around 1.5160, while MACD made a lower low, the bearish divergence is marked on both 15-min and hourly charts, which confirmed the trend reversal. After the shooting star, there is a quick drop caused by the 7:00 event - Bank of England's Official Bank Rate. There is no way to trade the event, which is almost 100-pip drop in just 1 minute. There is no need to chase the event either. After the event settling down, pound offered multiple great short opportunities for shrewd trader. There are three opportunities to short rally top, and at least two to add position at breakdown horizontal support level.
To summarize the forex strategies for the decline phase,
1. only short position is considered during the decline phase
2. entry A: short at rally top
3. entry B: short at breakdown horizontal support level
Just for argument's sake, the definition of phases is only for forex day trading purpose, which might be only identified on hourly or 15-min charts.


In the decline phase, the market is in a downtrend, usually a short selling day in The Taylor Trading Technique
On hourly chart, a bearish engulfing pattern indicated resistance at 1.5160, and the shooting star confirmed the resistance. A 40-pip top range was built from 1.5147 to 1.5106, which is a counterpart of base building phase. Likewise, there are multiple false breakout and breakdown signals to fool reckless bulls and bears.
Pound formed a double top pattern around 1.5160, while MACD made a lower low, the bearish divergence is marked on both 15-min and hourly charts, which confirmed the trend reversal. After the shooting star, there is a quick drop caused by the 7:00 event - Bank of England's Official Bank Rate. There is no way to trade the event, which is almost 100-pip drop in just 1 minute. There is no need to chase the event either. After the event settling down, pound offered multiple great short opportunities for shrewd trader. There are three opportunities to short rally top, and at least two to add position at breakdown horizontal support level.
To summarize the forex strategies for the decline phase,
1. only short position is considered during the decline phase
2. entry A: short at rally top
3. entry B: short at breakdown horizontal support level
Just for argument's sake, the definition of phases is only for forex day trading purpose, which might be only identified on hourly or 15-min charts.


Friday, April 24, 2009
Forex Strategies for the Advance Phase 04/23/09
In the last post I used British pound as an example to discuss the forex strategies for base building phase. On April, 23, pound made another textbook example for the second phase in a full price cycle - the advance.
In the advance phase, the market is in an uptrend, usually a buying day in The Taylor Trading Technique, in which the price action tends to make higher lows and higher highs. The five waves (wave 1 ~ 5) of elliott wave theory give a good description for an uptrend. Wave 1, 3, and 5 are impulsive waves, which is the main trend, while wave 2, and 4 are corrective waves, which is against the trend.
The 5-wave structure is labeled on hourly chart. The most tricky part is to identify wave 2 and 4, since both waves formed a downward channel. A normal trading strategy for the advance phase is to long dip bottom. If a long entry was made at the first dip bottom, it will be challenged during the formation of wave 2 and 4. If the stop is tight, long positions can be easily stopped out.
Best entry to follow the up momentum is to long at the breakout of the top of channel or add position at breakout of the horizontal resistance level. After the breakout, wave 5 surpassed former swing high and reached 50% Fibonacci retracement.
To summarize the forex strategies for the advance phase,
1. only long position is considered during the advance phase
2. entry A: long at end of wave 2
3. entry B: long at end of wave 4


In the advance phase, the market is in an uptrend, usually a buying day in The Taylor Trading Technique
The 5-wave structure is labeled on hourly chart. The most tricky part is to identify wave 2 and 4, since both waves formed a downward channel. A normal trading strategy for the advance phase is to long dip bottom. If a long entry was made at the first dip bottom, it will be challenged during the formation of wave 2 and 4. If the stop is tight, long positions can be easily stopped out.
Best entry to follow the up momentum is to long at the breakout of the top of channel or add position at breakout of the horizontal resistance level. After the breakout, wave 5 surpassed former swing high and reached 50% Fibonacci retracement.
To summarize the forex strategies for the advance phase,
1. only long position is considered during the advance phase
2. entry A: long at end of wave 2
3. entry B: long at end of wave 4


Wednesday, April 22, 2009
Forex Strategies for Base Building Phase 04/22/09
There are four phases in a full price cycle: base building, the advance, top building, and the decline. Different phases in a forex cycle require different forex strategies. Recent price action of British pound is a textbook example for trading during base building phase.
Monday (4/20/09) was the third down day for British pound, also a WS7 (wide spread 7) day. For swing traders, it's the time to collect their pips. For day traders, it would be unwise to chase any breakdown signal to naively believe they are following the trend. It's equally unwise to fade the trend too soon.
On Tuesday (4/21/09), there are two big bearish candles(see hourly candlestick chart) which took Monday's low. Impatient bulls were threaten to close their long positions, either by stop hitting or out of scare the trend will continue. To add salt to the wound, both breakdowns were fake. In that case, reckless bears got burned too. It is proved that chasing a breakdown after the third down day (WS7) is not a rewarding strategy.
After the second fake breakdown, pound made a rally, the dip from the rally made a higher low, which offered a nice spot for long entry.
On Wednesday (4/22/09), in light of Annual Budget Release, pound was hammered down 262 pips in two hours, and took Tuesday's low. The same scenario happened again - bold bears and bulls got burned dearly.
To summarize the forex strategies for base building phase,
1. chasing a sudden breakdown signal is not a high probability strategy
2. bottom guessing usually got burned during base building
3. Better wait for market out of base to make any commitment


Monday, April 20, 2009
04/20/2009 Forex Market Comments
Last Wednesday pound made a double top breakout at major resistance level of 1.49 on daily point and figure charts, which was proved to be a bull trap. On hourly PnF, pound made a double bottom breakdown at 1.4933. The slide broke former swing low at 1.4580/4584, and found support at 1.46 which formed a double bottom pattern on daily PnF. As long as pound stays below 1.46, I will remain bearish. On hourly chart, pound just made a head and shoulders top reversal and reached its minimal target at 1.4582.
1st downward target: 1.4622
2nd downward target: 1.4566
3rd downward target: 1.4510

This is the fourth down day for euro. There is a critical support at 1.2944 (61.8% fib retracement on daily chart).
1st downward target: 1.2873

There is no clear signal for yen on PnF. More information is needed to make an intelligent speculation.
1st downward target: 98.22
Tuesday, April 14, 2009
04/14/2009 Forex Market Comments
After good Friday's narrow range bar (NR20), yen chose to heading south. On the point and figure charts, yen made a bearish triple bottom breakdown at 99.50. The nearest downward target could be the 61.8% fib retracement level 98.03. The former swing low, also the 38.2% fib ret level 99.31 becomes resistance.

Yesterday British pound made a triple top breakout at 1.4766, a very bullish sign and beautiful up trending day for pound. The up thrust is not ready to challenge the former swing high 1.4956 yet. Pound formed a double top pattern.

Euro cooled off today, and remained below pivot point 1.3294 and 10-day ema 1.3300. There is no signal from point and figure charts. It's still an opportunity - an opportunity no to trade as stated in one of my day trading rules.
Thursday, April 9, 2009
Narrow Range Day for British Pound
British pound formed a narrow range bar (NR20/ID) yesterday. On hourly point and figure charts, pound is in a 100 plus pips trading range from 1.4766 to 1.4633. Pound had a fake breakout at early London session. If pound take a breakdown, the 1st downward target would be 4570. Possible support may come from 50% and 61.8% Fibonacci retracement - 1.4532 & 1.4432. To trade narrow range bar, it's not necessary to predict the direction of the breakout, the only thing need to do is to follow the market's leading.


Tuesday, April 7, 2009
04/07/09 London Session Forex Market Comments
All three major currency pairs reversed on hourly point and figure charts and took a breakdown of yesterday's low.
British pound also reversed on daily PnF at 1.46. The 1st downward target for pound is 1.4552, confluenced with 10-day ema 1.4553.
If euro touch 1.32, it will make a 3-box reversal on daily PnF too. The 1st downward target for euro is 1.3213. The 2nd target is 1.3117.
Japanese yen will make a reversal on daily PnF at 98. As long as yen stays above 100, forex trader shouldn't worry too much of current slide. The 1st downward target for yen is 99.44.
Monday, April 6, 2009
Japanese Yen Broke out 100 Key Level
Finally, Japanese yen broke out 100. Weak hands were shaken out by the temporary plunge initiated at the NFP, which stopped just 2pips shy to make a 3-box reversal on hourly point and figure charts. Japanese yen managed to crawl back and remain above 100 during the rest of day. On daily PnF, yen just made a double top breakout at 99. Surprisingly, Yen formed a narrow range bar (NR7) on the key 100 level breakout.


British pound made a double top breakout at the former double top resistance level 1.4766 on hourly PnF. On daily PnF, it's a double top breakout at 1.47. The key resistance level is 1.49 (former swing high 1.4978/1.4982). British pound made a new high in 20 trading days (H20).


Euro made a bear trap at the NFP event, then closed right above the pre-event level.

Subscribe to:
Posts (Atom)


